Cities With the Hardest Water in America (2026 Data Study)
Last updated: November 8, 2026 · Data: utility-reported water quality data via TapWaterData (CC BY 4.0) · Analysis: SoftWaterHQ
Madison, Wisconsin has the hardest water of any large U.S. city in our 2026 analysis, at 341 mg/L (19.9 grains per gallon). Henderson and Las Vegas, Nevada, Anaheim, California and Phoenix, Arizona round out the top five. Boston has the softest water at just 17 mg/L. Overall, 38 of the 86 large cities we ranked (44%) have hard or very hard tap water.
Hard water is one of the most common water quality issues in America, but how hard it is depends heavily on where you live. To find out which cities have the hardest and softest water, SoftWaterHQ analyzed utility-reported hardness for 99 of the largest U.S. cities and ranked the 86 with reliable, utility-level data. Here is what we found, plus the full rankings and our methodology.
Key findings
- Hardest water: Madison, WI at 341 mg/L (19.9 GPG)
- Softest water: Boston, MA at 17 mg/L (1 GPG)
- 44% of large cities (38 of 86) have hard or very hard water; 13 are very hard (over 180 mg/L)
- Median hardness: 112 mg/L (6.5 GPG), which is moderately hard
- Hardest region for big cities: the Southwest. Arizona, Nevada, Texas and California hold 15 of the top 20 spots
- Softest region: the Northeast, the Carolinas and the Pacific Northwest
The 10 Large Cities With the Hardest Water
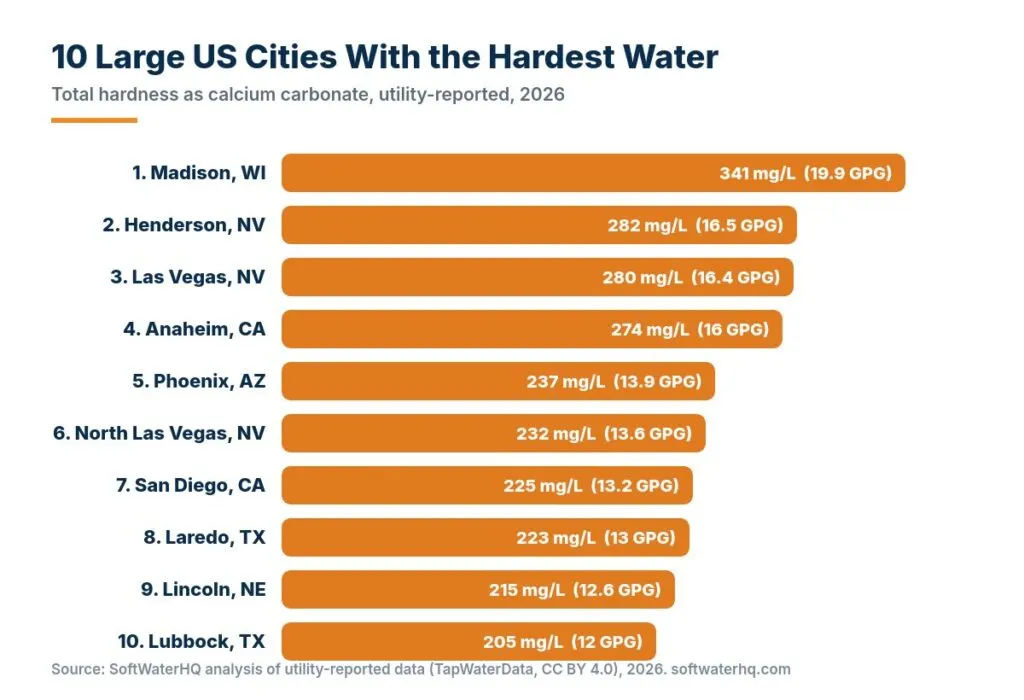
Many of the hardest-water cities share a source. Las Vegas, Henderson and North Las Vegas draw most of their water from the Colorado River through Lake Mead, and Phoenix-area and Southern California cities also rely on Colorado River water. As river and ground water move through limestone and other mineral-rich rock in the arid West, they pick up large amounts of calcium and magnesium. Madison, the top city on the list, is different: it gets its water from deep groundwater wells, and groundwater is often harder than surface water.
At 13 to 20 grains per gallon, homes in these cities typically see heavy scale on faucets and inside water heaters, spotty dishes and soap that will not lather. Most homeowners here benefit from a water softener.
The 10 Large Cities With the Softest Water

The softest-water cities mostly rely on surface water from protected mountain or forest reservoirs, where rain and snowmelt have little contact with mineral-rich rock. Boston’s supply comes from the Quabbin and Wachusett reservoirs, Portland, Oregon draws from the Bull Run watershed, Seattle from the Cedar and Tolt rivers, and New York City from its Catskill and Delaware reservoirs. Cities in the Carolinas and Georgia also tend to have soft water.
Soft water is not a problem for health, but very soft water can be more corrosive to pipes, which is why many of these utilities adjust pH or add corrosion control treatment.
Full Rankings: Water Hardness in 86 Large U.S. Cities
Ranked from hardest to softest. Hardness is total hardness as calcium carbonate (CaCO3). Where sources report a range for a city, we show the reported value and the range in brackets.
| Rank | City | Hardness (mg/L) | GPG | Category | Water utility |
|---|---|---|---|---|---|
| 1 | Madison, WI | 341 | 19.9 | Very hard | Madison Water Utility |
| 2 | Henderson, NV | 282 | 16.5 | Very hard | City of Henderson |
| 3 | Las Vegas, NV | 280 | 16.4 | Very hard | Las Vegas Valley Water District |
| 4 | Anaheim, CA | 274 (varies 274–329) | 16 | Very hard | City of Anaheim |
| 5 | Phoenix, AZ | 237 | 13.9 | Very hard | City of Phoenix Water Services Department |
| 6 | North Las Vegas, NV | 232 (varies 232–279) | 13.6 | Very hard | North Las Vegas Utilities |
| 7 | San Diego, CA | 225 | 13.2 | Very hard | City of San Diego Public Utilities Department |
| 8 | Laredo, TX | 223 (varies 223–275) | 13 | Very hard | City of Laredo |
| 9 | Lincoln, NE | 215 | 12.6 | Very hard | City of Lincoln |
| 10 | Lubbock, TX | 205 | 12 | Very hard | Lubbock Public Water System |
| 11 | Corpus Christi, TX | 199 | 11.6 | Very hard | City of Corpus Christi |
| 12 | Jacksonville, FL | 189 | 11.1 | Very hard | JEA |
| 13 | San Jose, CA | 185 | 10.8 | Very hard | San Jose Water |
| 14 | Tucson, AZ | 180 | 10.5 | Hard | City of Tucson |
| 15 | San Antonio, TX | 179 (varies 179–214) | 10.5 | Hard | San Antonio Water System |
| 16 | Indianapolis, IN | 178 | 10.4 | Hard | Citizens Water – Indianapolis |
| 17 | Scottsdale, AZ | 172 | 10.1 | Hard | City of Scottsdale |
| 18 | Glendale, AZ | 169 | 9.9 | Hard | City of Phoenix |
| 19 | Gilbert, AZ | 168 | 9.8 | Hard | Town of Gilbert |
| 20 | Lexington, KY | 158 | 9.2 | Hard | Kentucky American Water |
| 21 | Oklahoma City, OK | 157 | 9.2 | Hard | Oklahoma City Utilities |
| 22 | New Orleans, LA | 153 | 9 | Hard | Sewerage & Water Board of New Orleans |
| 23 | Santa Ana, CA | 150 | 8.8 | Hard | Irvine Ranch Water District |
| 24 | Plano, TX | 150 | 8.8 | Hard | City of Plano |
| 25 | Omaha, NE | 149 | 8.7 | Hard | Metropolitan Utilities District (Omaha) |
| 26 | Garland, TX | 146 | 8.5 | Hard | City of Garland |
| 27 | Mesa, AZ | 141 | 8.2 | Hard | City of Mesa |
| 28 | El Paso, TX | 140 | 8.2 | Hard | El Paso Water |
| 29 | Chicago, IL | 139 | 8.1 | Hard | City of Chicago Department of Water Management |
| 30 | Chandler, AZ | 139 | 8.1 | Hard | City of Chandler |
| 31 | Wichita, KS | 138 | 8.1 | Hard | City of Wichita |
| 32 | Albuquerque, NM | 137 | 8 | Hard | Albuquerque Water System |
| 33 | Tampa, FL | 137 | 8 | Hard | City of Tampa Water Department |
| 34 | Milwaukee, WI | 135 | 7.9 | Hard | Milwaukee Waterworks |
| 35 | Louisville, KY | 134 (varies 134–155) | 7.8 | Hard | Louisville Water Company |
| 36 | Spokane, WA | 131 | 7.7 | Hard | City of Spokane |
| 37 | Philadelphia, PA | 127 | 7.4 | Hard | Philadelphia Water Department |
| 38 | Los Angeles, CA | 121 (varies 95–121) | 7.1 | Hard | Los Angeles Dept. of Water and Power |
| 39 | Orlando, FL | 120 | 7 | Moderately hard | Orlando Utilities Commission |
| 40 | Washington, DC | 117 | 6.8 | Moderately hard | DC Water |
| 41 | Kansas City, MO | 116 | 6.8 | Moderately hard | KC Water |
| 42 | Cincinnati, OH | 113 | 6.6 | Moderately hard | Cincinnati Public Water System |
| 43 | Dallas, TX | 112 | 6.6 | Moderately hard | Dallas Water Utility |
| 44 | Riverside, CA | 112 | 6.5 | Moderately hard | Eastern Municipal Water District |
| 45 | Cleveland, OH | 111 | 6.5 | Moderately hard | Cleveland Public Water System |
| 46 | Tulsa, OK | 110 | 6.4 | Moderately hard | City of Tulsa |
| 47 | Anchorage, AK | 110 | 6.4 | Moderately hard | Anchorage Water & Wastewater Utility |
| 48 | Reno, NV | 102 (varies 81–102) | 6 | Moderately hard | Truckee Meadows Water Authority |
| 49 | Aurora, CO | 100 | 5.8 | Moderately hard | Denver Water Board |
| 50 | Pittsburgh, PA | 100 | 5.9 | Moderately hard | Pennsylvania American Water |
| 51 | Huntsville, AL | 100 (varies 77–100) | 5.9 | Moderately hard | Huntsville Utilities |
| 52 | Irvine, CA | 98 | 5.8 | Moderately hard | Irvine Ranch Water District |
| 53 | Columbus, OH | 97 | 5.7 | Moderately hard | Columbus Public Water System |
| 54 | Denver, CO | 97 | 5.7 | Moderately hard | Denver Water Board |
| 55 | Detroit, MI | 97 | 5.6 | Moderately hard | City of Detroit |
| 56 | Houston, TX | 96 (varies 96–119) | 5.6 | Moderately hard | City of Houston |
| 57 | Fort Wayne, IN | 95 | 5.6 | Moderately hard | Fort Wayne City Utilities |
| 58 | Arlington, TX | 91 | 5.4 | Moderately hard | City of Arlington |
| 59 | Nashville, TN | 89 | 5.2 | Moderately hard | Metro Water Services (Nashville) |
| 60 | Minneapolis, MN | 89 | 5.2 | Moderately hard | City of Minneapolis |
| 61 | Buffalo, NY | 87 | 5.1 | Moderately hard | Buffalo Water Authority |
| 62 | Irving, TX | 81 | 4.7 | Moderately hard | City of Irving |
| 63 | Toledo, OH | 76 | 4.4 | Moderately hard | City of Toledo |
| 64 | Jersey City, NJ | 73 | 4.3 | Moderately hard | Jersey City MUA |
| 65 | Austin, TX | 68 (varies 68–82) | 4 | Moderately hard | Austin Water |
| 66 | Richmond, VA | 67 | 3.9 | Moderately hard | Henrico County Water System |
| 67 | Fremont, CA | 65 (varies 44–65) | 3.8 | Moderately hard | Alameda County Water District |
| 68 | Virginia Beach, VA | 52 | 3 | Soft | City of Virginia Beach |
| 69 | Sacramento, CA | 45 (varies 45–91) | 2.6 | Soft | City of Sacramento |
| 70 | Memphis, TN | 40 | 2.4 | Soft | Memphis Light, Gas, & Water |
| 71 | Newark, NJ | 37 | 2.2 | Soft | Newark Water Department |
| 72 | Colorado Springs, CO | 36 | 2.1 | Soft | Colorado Springs Utilities |
| 73 | Greensboro, NC | 36 | 2.1 | Soft | City of Greensboro |
| 74 | Oakland, CA | 34 (varies 16–34) | 2 | Soft | East Bay MUD |
| 75 | Bakersfield, CA | 34 (varies 34–49) | 2 | Soft | Cal Water (Bakersfield) |
| 76 | Chesapeake, VA | 33 (varies 1–33) | 2 | Soft | City of Norfolk |
| 77 | New York, NY | 31 (varies 31–64) | 1.8 | Soft | New York City System |
| 78 | Charlotte, NC | 31 | 1.8 | Soft | Charlotte Water |
| 79 | Seattle, WA | 31 (varies 31–53) | 1.8 | Soft | Seattle Public Utilities |
| 80 | Durham, NC | 30 | 1.7 | Soft | City of Durham |
| 81 | San Francisco, CA | 25 (varies 1–25) | 1.5 | Soft | SFPUC City Distribution Division |
| 82 | Raleigh, NC | 25 | 1.5 | Soft | City of Raleigh |
| 83 | Atlanta, GA | 24 | 1.4 | Soft | City of Atlanta |
| 84 | Winston-Salem, NC | 24 | 1.4 | Soft | City of Winston-Salem |
| 85 | Portland, OR | 20 | 1.2 | Soft | Portland Water Bureau |
| 86 | Boston, MA | 17 | 1 | Soft | Boston Water and Sewer Commission (MWRA) |
Want the number for your own street? Look it up with our water hardness by ZIP code tool, or see averages for every state on our US hard water map.
Read our detailed water hardness by city guides for Las Vegas, Phoenix, San Diego, San Antonio and more.
What the Numbers Mean
| Category | mg/L (ppm) | Grains per gallon | Large cities in this range |
|---|---|---|---|
| Soft | 0 to 60 | 0 to 3.5 | 19 |
| Moderately hard | 61 to 120 | 3.5 to 7 | 29 |
| Hard | 121 to 180 | 7 to 10.5 | 25 |
| Very hard | Over 180 | Over 10.5 | 13 |
The categories follow the U.S. Geological Survey scale. Hard water is not a health risk, and the EPA sets no limit for it, but above about 7 GPG most homes notice scale, spotty dishes and dry skin. Learn more in what is hard water.
Hard Water by Region
- Southwest (hardest): Arizona, Nevada, Southern California and much of Texas. Colorado River water and desert groundwater are naturally high in minerals.
- Great Plains and Upper Midwest: Nebraska, Kansas, Wisconsin and Indiana cities often have hard water from limestone aquifers.
- Northeast, Carolinas and Pacific Northwest (softest): reservoirs fed by rain and snowmelt over granite and forest soils produce soft water.
Hardness can still vary a lot within a region, and even within a city, depending on which treatment plant or well field serves your neighborhood.
Methodology
- Cities: we started with 99 of the largest U.S. cities by population.
- Data: total hardness from the TapWaterData U.S. Water Hardness Dataset (2026), which compiles utility water quality reports (Consumer Confidence Reports) and utility-reported calcium and magnesium results. Values are total hardness as calcium carbonate.
- Included: only cities with hardness reported by their main water utility.
- Excluded (no utility-level data, county estimates only): Baltimore, MD; Long Beach, CA; Honolulu, HI; Saint Paul, MN; St. Louis, MO; St. Petersburg, FL and Boise, ID.
- Excluded (sources disagree by more than 100 mg/L, or the utility softens water and the reported figure could not be confirmed): Miami, FL, Chula Vista, CA, Fort Worth, TX, Norfolk, VA, Fresno, CA, Stockton, CA.
- Limits: a city’s water can come from several plants or wells, so hardness at your tap may differ from the citywide figure. Utilities update their reports every year.
Use This Data
Journalists, bloggers and researchers are welcome to use these rankings and charts. Please credit SoftWaterHQ with a link to this page. Suggested citation: “Cities With the Hardest Water in America (2026),” SoftWaterHQ, softwaterhq.com/hardest-water-cities/, based on TapWaterData (CC BY 4.0). For questions or a city you would like added, contact us.
What to Do If Your City Has Hard Water
- Check your exact number with our ZIP code lookup or a home test.
- Above about 7 GPG: consider a water softener. See what size softener you need and what it costs.
- Want to reduce scale without salt? Compare salt-free conditioners.
- Already have spots and crust? Here is how to remove hard water stains.
Frequently Asked Questions
Which U.S. city has the hardest water?
Among the large U.S. cities in our 2026 analysis, Madison, Wisconsin has the hardest water at about 341 mg/L (19.9 grains per gallon), followed by Henderson and Las Vegas, Nevada.
Which major U.S. city has the softest water?
Boston has the softest water of the large cities we ranked, at about 17 mg/L. Portland, Oregon, Winston-Salem, Atlanta and Raleigh also have very soft water.
Which state has the hardest water?
Looking at statewide medians rather than big cities, Nebraska, Kansas, Wisconsin, Michigan and Utah have the hardest water in our data. Among large cities, the Southwest dominates: Arizona, Nevada, Texas and California hold 15 of the 20 hardest spots. See every state on our US hard water map.
Is hard water bad for you?
No. Hard water is not considered a health risk, and the EPA has no health limit for hardness. It mainly causes scale, spotty dishes, poor soap lather and dry skin.
How can I find out how hard my water is?
Check your utility’s annual water quality report, use a hardness test strip, or look up your ZIP code with the SoftWaterHQ water hardness lookup tool.
Sources: TapWaterData US Water Hardness Dataset (CC BY 4.0); USGS: Hardness of Water; EPA: Secondary Drinking Water Standards.